.png?width=347&height=97&name=Data%20Council%20AI%20logo%20(1).png "Data Council")
Life comes at you fast. Data even more so ...
When the engineering team at Circonus began to feel the pain of systems at scale, there were some common observability tools that provided them with a firehose of operational time series telemetry. However, managing all that data, yet alone making sense of it, was extremely difficult. And the existing tools they tried for managing time series metrics either didn't give mathematical insight, or fell over at modest workloads. They needed a better solution. So they decided to look into other statistical tooling options that had proven themselves for decades in other industries.
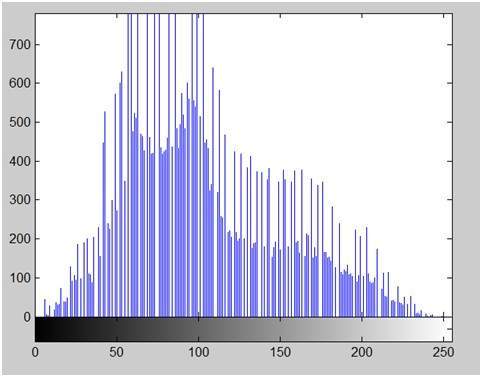
When Fred Moyer, an engineer on the team, started to look into visual solutions to make sense of their ops data, he was surprised to discover that histograms proved to be an extremely helpful visual processing tool. Fred discovered there was a broad range of techniques he could employ to histogram data (inverse quantiles, for example) to produce insights into end user impact. Not only this, but he could effectively operate on hundreds of millions of data points in real time.
Meet Fred Moyer of Circonus
 Fred Moyer is a software engineer at Circonus. He is a recovering Perl and C programmer, and these days likes to hack in Go and is learning Lua. Fred has been active in open source development for almost 20 years. He is a 2013 White Camel award winner, obtained a graduate degree in Mechanical Engineering, and his undergrad double in Mechanical Engineering and Materials Science.
Histograms became a key component of the time series data technology toolset Circonus created to manage the high volume time series needs of today's distributed systems. The team implemented their system C and assembly, and built a robust platform to effectively manage and make sense of your ever increasing operational dataset.
In his talk, "Effective Management of High Volume Numeric Data with Histograms," Fred will explain the insights he discovered when he started to implement histograms to help gain insight into ops data. He'll perform a comparison of different types of histograms, and then dive into practical programmatic techniques using the log linear histogram example.
Want to hear more talks like this? Join us at DataEngConf SF '18 and be part of the biggest technical conference around data science and engineering.